Ichimoku Kinko Hyo
This is a practical guide which will help you to use
Ichimoku in your trading.
Ichimoku Kinko Hyo is a Japanese
investing technique. It provides all – trading signals, resistance and support
levels. It is very different from normal western techniques such as trading
with moving averages, but after a while you should understand it easily. It was
created around 50 years ago by Japanese journalist Goichi Hosoda. He started to
work on Ichimoku before World War II. To the West, this technique is know from
90s, just like candles it was unknown for many decades.
First, let’s see how Ichimoku is build. Later we will check
how it can be used in trading stocks and Forex.
Ichimoku components
Ichimoku Kinko Hyo is build from 5 averages (notice – these
are different averages than standard moving average that you know):
·
Senkou Span A and Senkou Span B –
area between them is called Kumo, or simply just Ichimoku cloud. This is a
resistance and support area
·
Kijun-Sen – longer signal average
·
Tenkan-Sen – shorter signal average
·
Chikou Span – this average is
shifted back by 26 periods
So when we put this together, we’ve got a ready investing
system:
 |
| ichimoku components |
Time to learn more about each component.
Kumo (Ichimoku cloud)
Usually, we look for support or resistance right at moving
average or support line. Ichimoku cloud is different – it is area of possible
resistance or support. The thicker cloud is, the stronger resistance or support
should be at this place. If cloud is thin, than possible support/resistance
should be weak.
 |
| thin and thick ichimoku cloud |
When price manage to break out or break down from cloud,
then this is a strong signal to take position, because it happens rarely.
price
break from cloud – examples
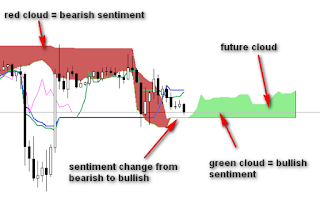
There is one more interesting thing about cloud. It is
shifted forward, this part is called future kumo. When future kumo changes
color from red to green, then there is a shift in sentiment.
Cloud has two colors – one (usually red) when the sentiment
is bearish, and second (most often green) when sentiment is bullish.
 |
| future kumo and cloud colors |
Kijun Sen
It is longer average, based on 26 periods. Let’s compare
Kijun Sen and 26 moving average:
 |
| kijun-sen vs. normal moving average |
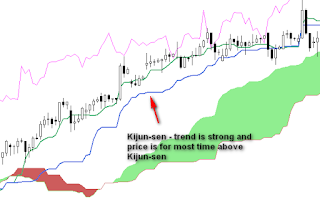
As you can see, it acts different. From my experience, I can
say that Kijun Sen itself is a good resistance/support level.
 |
| kijun-sen |
Tenkan Sen
It is shorter average. Based with Kijun Sen it gives signals
to buy and sell (more on that later). When trend is strong, it can also act as
support/resistance.
 |
| tenkan-sen |
Chikou Span
Chikou Span is a close price shifted 26 periods back. It is
little unclear, but this example should help us to understand that:
 |
| chikou-span |
The main idea behind Chikou Span is that it helps to compare
current price with price from 26 periods before. The end of Chikou Span is the
current price close. Based on that we know if the current sentiment is bullish
(Chikou Span above price) or bearish (Chikou Span below price). So this is
another Ichimoku component which helps us to determine current sentiment, the
previous one was Kumo.
Chikou Span as suport/resistance
Chikou Span is following current price and it has highs and
lows because that is the way price move. We can use that points to draw support
and resistance lines.
 |
| resistance lines based on chikou span |
Is this better than standard support and resistance lines?
To be honest, not so much. You can stick with standard support/resistance
levels and you will be good. Just wanted to show you that this is another
possible way of using Chikou Span.
Trading signals from Ichimoku
First, one thing need to be explained. Ichimoku Kinko Hyo
gives you picture of current situation at markets. It also comes with sets of
trading signals. That does not mean that you have to stick to these signals.
You can use Ichimoku as a base to build your own trading system. That’s what I
did and from what I know, many other traders.
Tenkan and Kijun Sen cross
This is a first signal we can take. When shorter average
Tenkan crosses with Kijun from the bottom, then this is a buy signal. There are
three types of buy signal: weak, medium, strong.
Weak buy signal – cross below cloud
 |
| weak buy signal |
Medium buy signal – cross inside cloud
 |
| medium buy signal |
Strong buy signal – cross above cloud
 |
| strong buy signal |
That make sense. When buy signal occurs below cloud, that
means that resistance area is above so sentiment is more bearish at the moment.
When buy signal occurs above cloud, then sentiment is bullish, there is no
strong resistance above.
Similar situation is with sell signal (signal to take short
position). There are three types of sell signal: weak, medium, strong.
Weak sell signal – cross above cloud
 |
| weak sell signal |
Medium sell signal – cross inside cloud
 |
| medium sell signal |
Strong sell signal – cross below cloud
 |
| strong sell signal |
Confirmation from Chikou Span
When you take signals based on cross of Tenkan Sen and Kijun
Sen, then you may want to wait for confirmation from Chikou Span. This is
optional, and many traders do not use this that way.
Let’s say that there is a buy signal from Kijun and Tenkan Sen. Then we wait
for confirmation from Chikou Span – so the moment when Chikou Span will cross
the price.
Check following example:
 |
| confirmation from chikou span |
Breakout from Ichimoku cloud
This is my favorite signal to take position. By now you know
that cloud acts as a support when price is above Ichimoku cloud and as
resistance when price is below cloud. It is not that often when price changes
sides. When it happens, then it is a sign that there is a shift in sentiment.
When price is below cloud and it breaks up, then it is a signal
to take long position.
 |
| break out from cloud |
When price is above cloud and it breaks down from the cloud,
then it is signal to go short.
 |
| break down from cloud |
The good idea is to place stop loss on the other side of
cloud. This signal may be very effective – check how it works on weekly time
frame. Of course it works also on lower time frames.
Break above/below Kijun Sen
Another signal to take position. Kijun Sen is longer average
and when price break above Kijun Sen, then this may be signal to buy.
 |
| kijun-sen – signal to go long |
When it breaks below Kijun, then this is a sell.
 |
| kijun-sen – signal to short |
It is similar to normal averages – when price breaks above
50 or 200 moving average, then many traders go long.
When to close trade
Normally we close the trade when there is another cross of
Kijun and Tenkan Sen:
You will notice fast that this signal is very slow. When the
move ends, there is often strong sell off and you may lose most of your profit.
Is there a better way?
I recommend three options:
·
Exit trade when price close on the
other side of Kijun sen.
·
Exit trade when price closes below
recent low (in an uptrend). So basically, you are rising your stop loss every
time new low is made.
·
Join Ichimoku with oscillator and
close based on signal from it.
Check examples to see how it works in practice.
Best time frame for Ichimoku
Ichimoku Kinko Hyo works on every time frame. In my opinion,
on lower time frames Ichimoku is less accurate. It is because on lower time
frames moves are more rapid. On lower times automated trading is very popular,
but it affects the way price move. On the other hand it does not mean that
there are no trends on lower time frames and where we have trends, there we can
trade with Ichimoku.
You have to test what time frames works best for you. I have
very good results with longer time frames, even as long as weekly and monthly.
Let’s look at weekly Apple chart. We know now that Apple is in very strong
uptrend since 2009, but it wasn’t that clear few years back. How does it look
on weekly chart?
 |
| weekly Apple chart and ichimoku |
We can see that there was a breakout from cloud. In years
2006-1014 breakout from cloud took place only six times. If you followed this
signal in 2009, you could make some serious money.
This is a good example that Ichimoku is great to catch big trends. On higher
time frames situation is clearer, so it is a good idea to test what signals we
can get from higher time frames.
Best market for Ichimoku
Same as with time frame, Ichimoku works on every kind of
market. It does not matter if you trade stocks, Forex, or commodities. If you
have a chart and you can spot trends, then it is a good place to try Ichimoku.
EXAMPLES
Examples below show different ways of trading with Ichimoku.
Test it in practice and choose the best for you.
On daily SP500 chart we saw a break out from cloud. We took
long position and placed stop loss below cloud. After some problems in the
beginning, trends got stronger. We moved our stop loss below Kijun-sen.
Decision is that we close trade as soon as there is a close below Kijun-Sen
which happened in the end of February. Few days later there was a signal to
reenter a trade – price moved back above Kijun-sen and there was a cross of
Kijun-sen and Tenkan-sen. We took long position. Again, trade should be closed
when price will close below Kijun-sen.
 |
| daily SP500 and ichimoku |
On this eurusd 5 minute chart we wait for Tenkan-sen and
Kijun-sen cross. When it happened, it was time to take long position with tight
stop loss right below recent low. We planned to close trade after another
Tenkan and Kijun-sen cross which happened after nice move up.
 |
| 5 minute eur/usd |
3 Indikator Ampuh Untuk Trading Trend


